How I Built the AI Hub Heatmaps

I keep reading “where the AI jobs are” articles that cite the same five rankings, all of which cite the same three reports, all of which cite each other. The data should be the news, not the citation chain. So when I sat down to make a video on where AI is actually happening in the world, I pulled the raw data myself.
I’m a data scientist by training, and one of the things I miss in the CEO chair is doing the actual analysis. This was an excuse to keep those muscles warm: pandas, plotly, a couple of public APIs, and a Saturday. Two heatmaps came out of it, one for the United States and one for the world. Here is how I built them, what I found, and where the methodology has limits. Everything is in a public repo so you can check my work.
The U.S. heatmap: BLS, the boring source nobody uses
The Bureau of Labor Statistics publishes a 38 megabyte zip file every May with metropolitan-level employment for every Standard Occupational Classification code in the country. Anyone can download it. Almost nobody does, because it is unglamorous and the column names are exhausting.
I pulled the May 2025 release, which BLS published this morning. Filtered to two SOC codes:
- 15-1221: Computer and Information Research Scientists
- 15-2051: Data Scientists
Together these are the closest thing the federal government has to a head count of working AI professionals. They miss software engineers who do AI as a slice of their job. They include statisticians who wouldn’t call themselves AI workers. The signal is imperfect. It is also more rigorous than scraping LinkedIn job titles, which is what most AI ranking articles do.
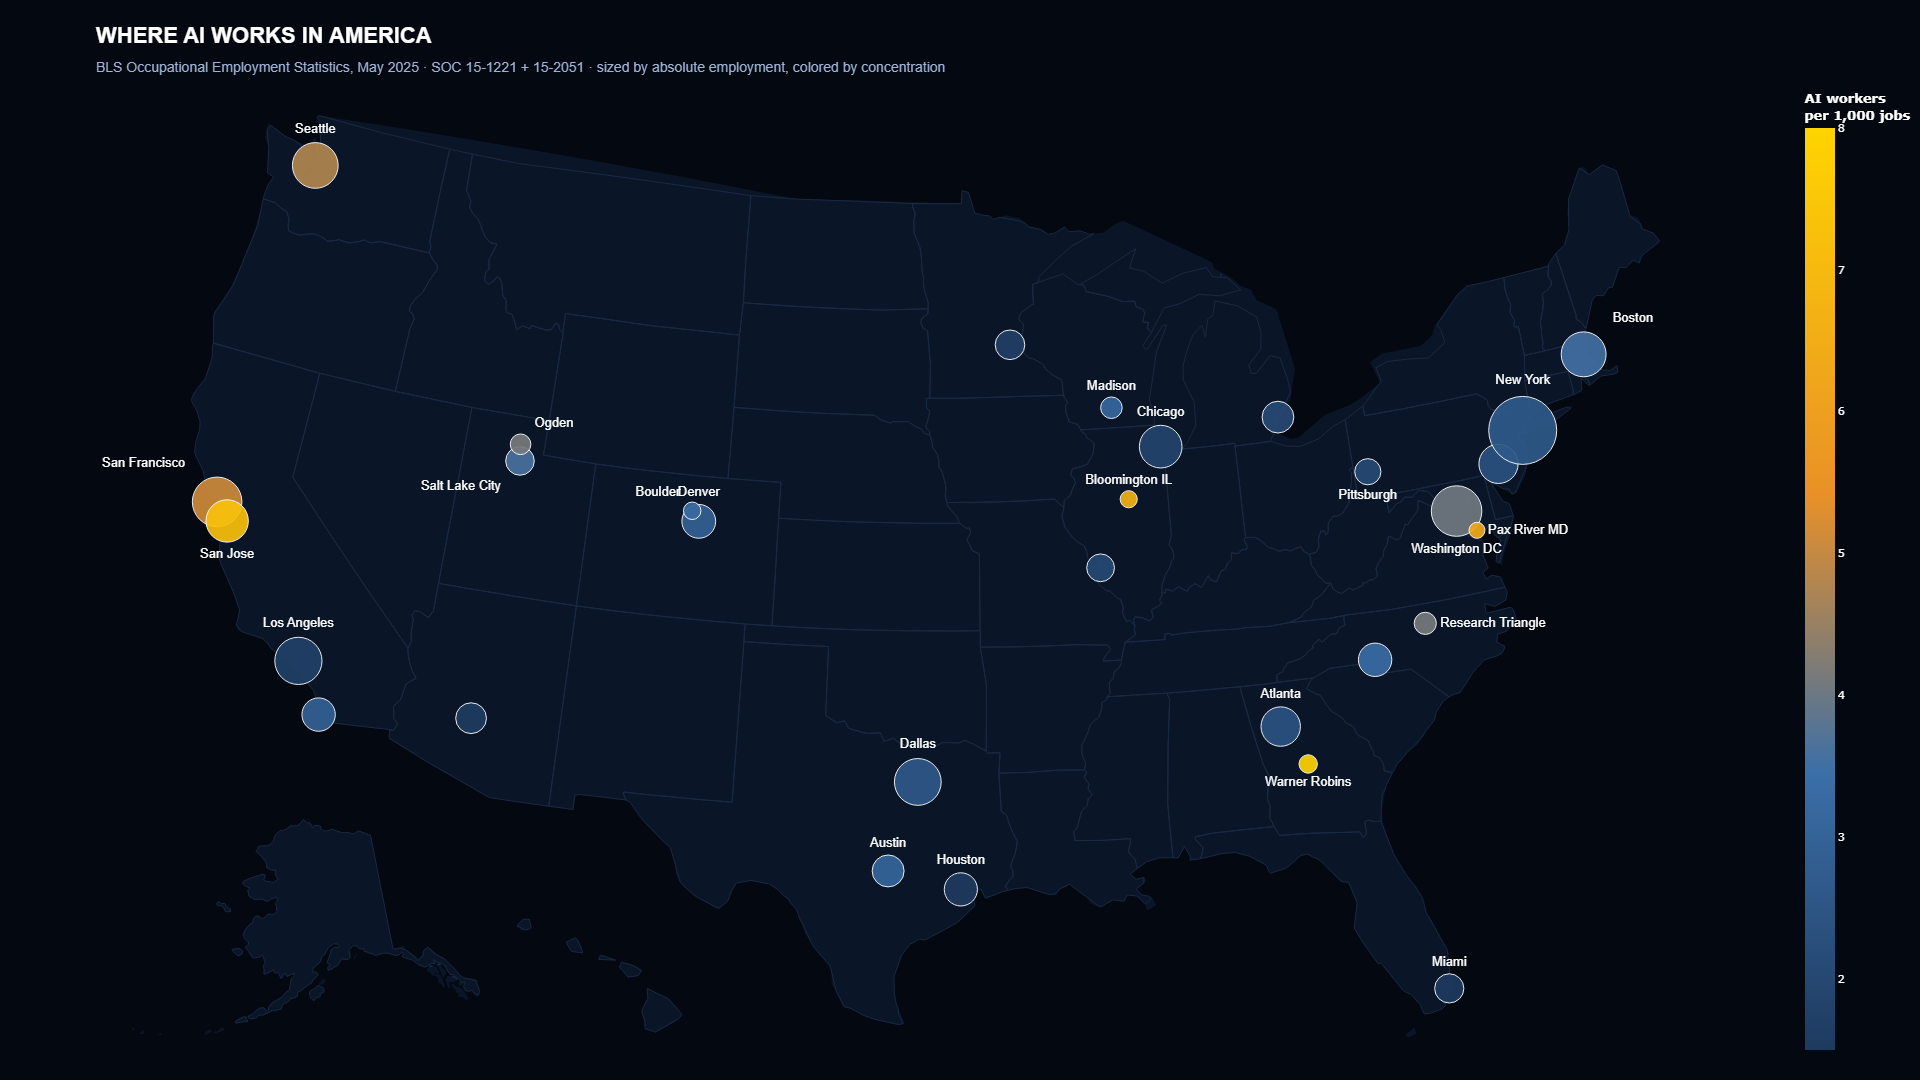
I aggregated by Metropolitan Statistical Area (MSA), the U.S. Census and OMB definition that bundles a core city with its commuter-tied surrounding counties. Computed two metrics: absolute employment, and concentration per thousand workers. The two tell different stories.
By absolute count, New York leads at 25,260 working AI professionals, up roughly nineteen percent from the May 2024 release. Washington DC is second at 12,680. San Francisco-Oakland is third at 12,130. By concentration per thousand workers, Warner Robins, Georgia tops the list at 9.99 per thousand, anchored by AI roles at Robins Air Force Base and the Warner Robins Air Logistics Complex. San Jose comes in second at 7.29, down slightly from 7.72 a year ago. Bloomington, Illinois lands third at 6.70 (State Farm and Country Financial run substantial data science staffs in a town most people associate with corn). Lexington Park, Maryland is fourth at 6.37, anchored by Naval Air Station Patuxent River. Huntsville dropped out of the top ten this cycle. Defense AI and corporate-headquarters AI are the two most concentrated AI labor markets in the country, and nobody outside their specific zip codes talks about either one.
Files in the repo:
- Code:
scripts/fetch_bls_oews.pyandscripts/render_usa_heatmap.py - Data:
data/usa_ai_employment_by_msa.csv - Findings:
data/usa_findings.md - Heatmap:
images/Heatmap-USA-AI-Jobs.png
The world heatmap: OpenAlex, the open Google Scholar
OpenAlex indexes 250 million scholarly works with structured metadata about authors, affiliations, and concepts. It is free. It has an API. It is one of the most underutilized data sources in commercial AI commentary.
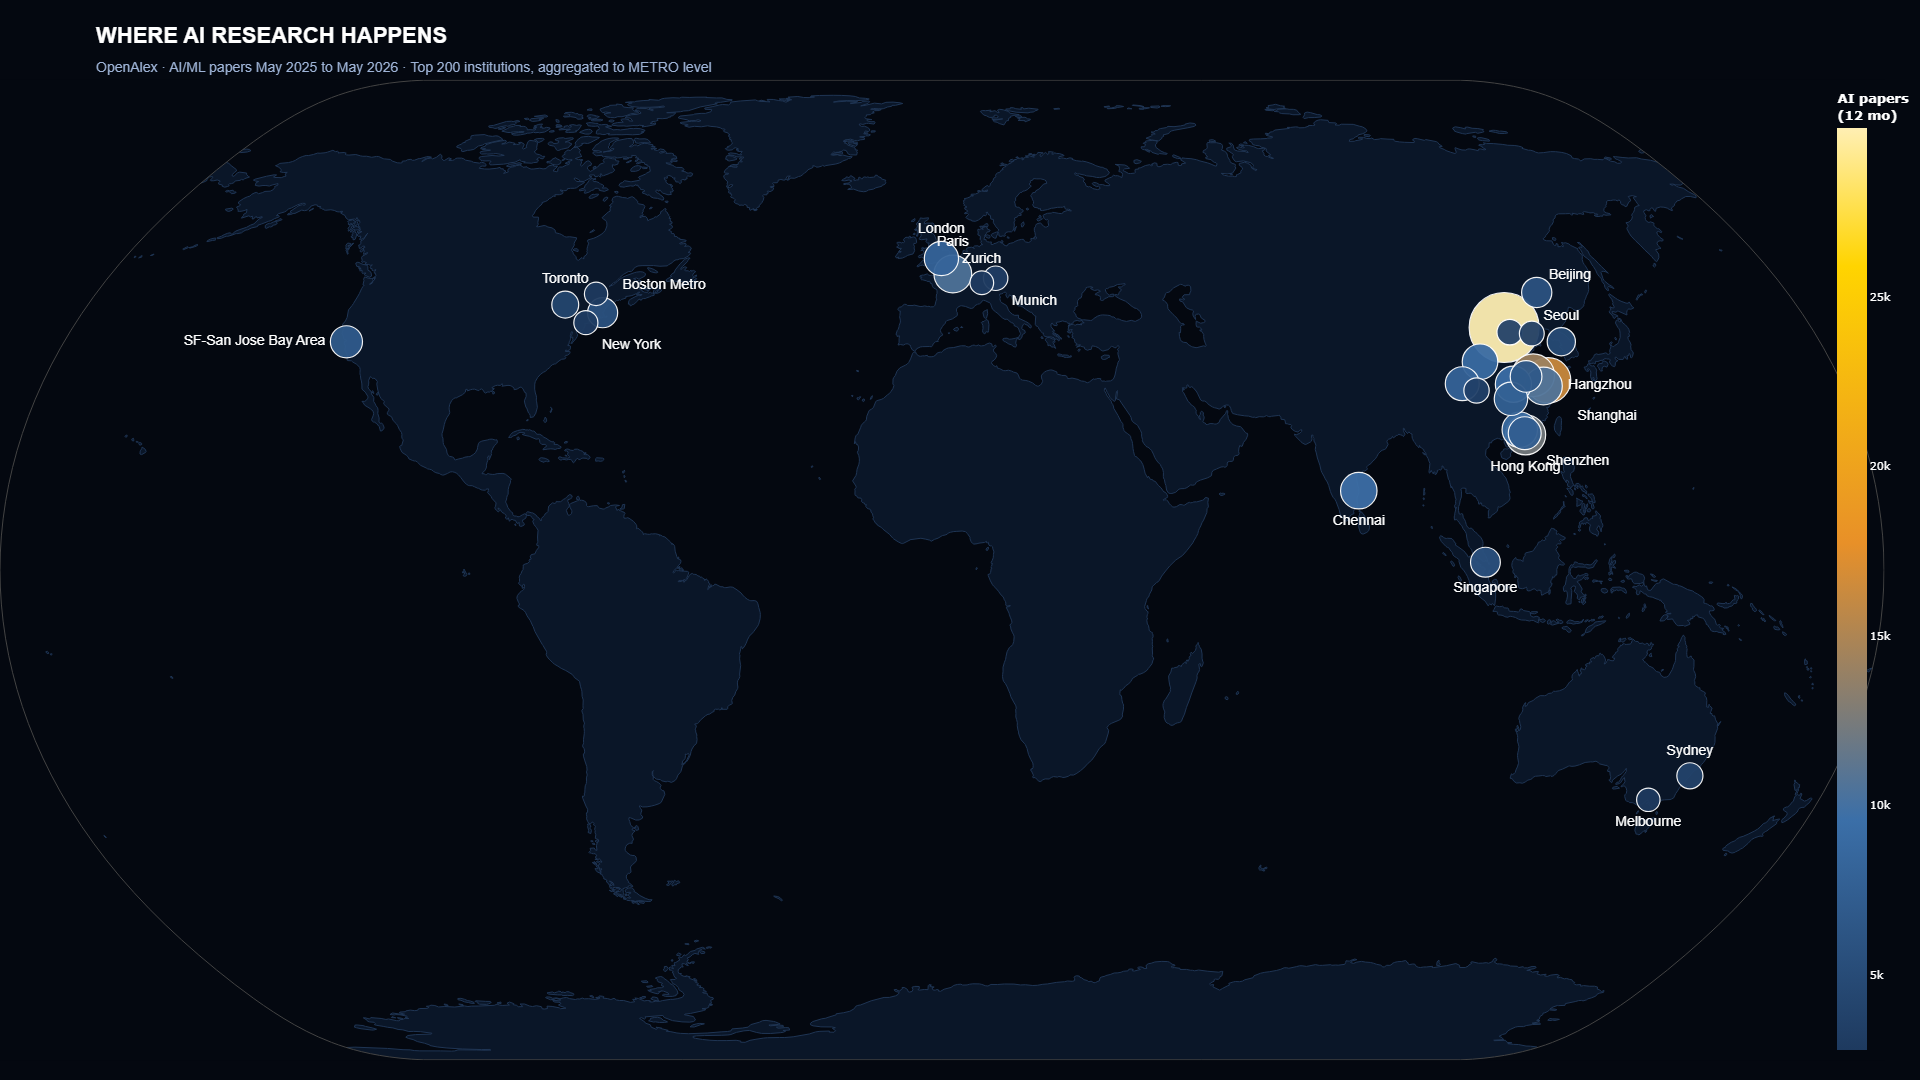
I queried for papers tagged with the Artificial Intelligence concept published from May 2025 through May 2026, grouped by author institution, pulled the top 200, and joined each institution to its city.
Then I did something the original draft of this analysis didn’t do: I rolled the cities up to metros. OpenAlex tags institutions by city. Beijing’s 15 universities all tag “Beijing,” which is one city, one metro, coherent. But the U.S. Bay Area gets fragmented across “Stanford,” “Mountain View,” “Berkeley,” “San Francisco,” and “San Jose.” Five separate tags for one metro. Without aggregation, the Bay Area looks small and China looks artificially dominant.
So I hand-curated a city → metro mapping using proper U.S. Census MSAs/CSAs for U.S. metros, kept the international cities as-is (they’re already metro-coherent), and consolidated Hong Kong’s districts. Three cases were all that needed fixing: Bay Area, Boston Metro, Hong Kong. Everything else passes through.
What fell out is a different story than the executive consensus. Beijing leads at 42,843 AI papers in twelve months, more than Paris, London, Munich, and Zurich combined. Hong Kong jumps to #4 globally once you aggregate. China takes 13 of the top 30 metros. The U.S. is competitive but distributed: SF-San Jose Bay Area at #15 with 6,997 papers (Stanford + Google + Berkeley), Boston Metro at #18 with 5,863 (Harvard + MIT), Pittsburgh at 1,997 (Carnegie Mellon).
The honest caveat is that paper count is not paper quality. NeurIPS and ICML acceptances still skew American. Chinese AI research clusters in mid-tier journals more than Western research does. Volume does not always win. Volume usually wins eventually.
The hidden hubs are the ones I did not expect. Switzerland’s Zurich publishes 2,931 papers from two institutions, ETH and EPFL, the highest density per researcher on Earth. Singapore at NTU and NUS produces roughly the AI output of Australia from a city the size of Brooklyn. Hangzhou is the place outsiders do not know yet, with five institutions and the home address of DeepSeek.
Files in the repo:
- Code:
scripts/fetch_openalex_world.py,scripts/aggregate_to_metro.py, andscripts/render_world_heatmap.py - Data:
data/world_ai_research_by_institution.csv(raw),data/world_ai_research_by_metro.csv(aggregated) - Findings:
data/world_findings.md - Heatmap:
images/Heatmap-World-AI-Cities.png
Where this methodology breaks
I am measuring different things in each map: the U.S. map measures employment and the world map measures research output. Combining them into a single ranking would be apples to oranges. They are two slices of reality, and I will say so on camera.
Other limitations:
- AI definition is fuzzy. SOC 15-1221 and 15-2051 are imperfect proxies. OpenAlex’s “Artificial Intelligence” concept catches papers from biology and fusion physics. I filtered the most obvious noise but the boundary is genuinely soft.
- Metro aggregation is hand-curated, not algorithmic. The mapping covers the three cases that fragment in our top 30. For more rigorous future global aggregation, the upgrade path is the EU JRC’s GHSL Urban Centre Database (~13,000 global urban centres).
- Snapshot, not trend. This is one moment in time. I’ll re-run it quarterly.
If you want to extend the analysis, the obvious next layers are AI startup funding by metro (Crunchbase covers it), AI patent filings (USPTO and WIPO have free data), and GPU compute capacity by region (more sensitive, harder to source). I will probably do those next.
If anything I published is wrong, the data and code are linked. I would rather correct a number than defend one.
The repo is at github.com/ERoske/where-is-ai. MIT licensed. Clone it, fork it, point out my mistakes, run the math better. That’s the point.